Is Any of This Even Running? Building the Lab's Single Pane of Glass
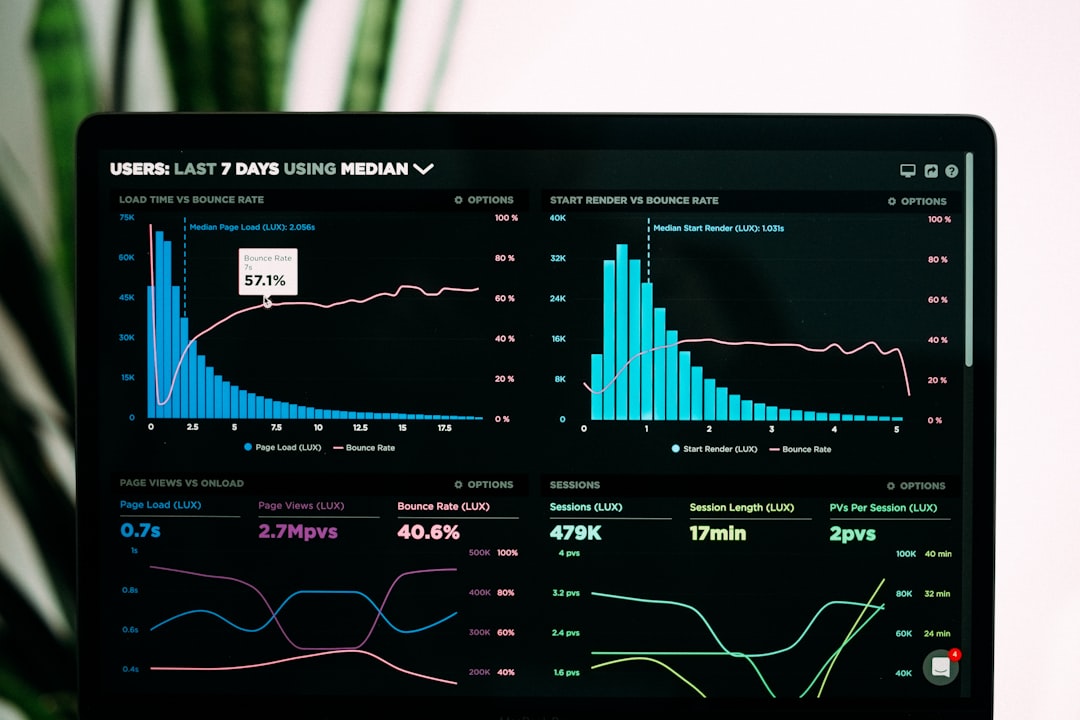
Summary: There's a moment in every growing homelab where you lose track. Not of anything dramatic - you just cannot say, off the top of your head, whether all the things you built are currently running. This post is about the small service that answers that question, and about a distinction that turned out to matter far more than I expected: the difference between a service being reachable and a service working.
Is Any of This Even Running?
Losing track
By the time the lab had four machines, it had somewhere north of twenty services. Speech-to-text, text-to-speech, a gateway, a retrieval service, a skill service, a logging aggregator, a health service, exporters on three hosts, a couple of user interfaces. Each one had been a good idea. Each one had a deploy script and a systemd unit and, mostly, worked.
And I could not tell you, at any given moment, whether they all were.
The failure mode is quieter than you'd think. Nothing announces itself. A service dies at 2 AM after a bad deploy or an OOM, and everything downstream degrades in some way you don't immediately connect to it - the assistant gets a bit worse at answering personal questions, or the wall lights stop reflecting reality, and you spend twenty minutes debugging the symptom before it occurs to you to check whether the thing it depends on is alive.
I'd been checking by hand. systemctl status over SSH, one host at a time, when something felt off. That works when you have four services. At twenty it's a chore you skip, and a check you skip is a check you don't have.
What "up" actually means
So I built a small service whose only job is to ask everything else if it's okay, and to publish the answer in one document. It's the boring centre of the lab and it's the thing I'd build first if I started over.
But writing it forced a question I'd been vague about: what does "up" mean?
The naive version is that the port accepts a TCP connection. That's easy, and it's nearly worthless. A Python process that has wedged itself into a state where it accepts connections and answers nothing will pass that check forever. I've had exactly that happen - the socket was open, the service was dead, and my monitoring was green.
The better version asks for something the service has to actually do to answer: an HTTP endpoint that touches enough of its own machinery to prove it's working. Most services here expose a health endpoint that does a little real work rather than returning a constant.
So there are two kinds of probe. HTTP where a service can meaningfully answer, TCP where it can't - some things are just a port, and pretending otherwise would be worse than admitting it. What I try never to do is let those two look identical in the output, because a TCP-only check is a weaker claim and the dashboard should say so.
Timeouts are a design decision, not a default
Every probe has a three-second timeout.
That number is not arbitrary and I'd encourage you to pick yours deliberately rather than inheriting whatever your HTTP client does. The reasoning goes like this: if I'm checking twenty services and one of them is hung, a default timeout of thirty seconds means my status page takes half a minute to load. In practice it means I stop opening it. The monitoring becomes the thing that's too slow to use, at exactly the moment you need it, which is a very silly way to lose.
Three seconds is long enough that a healthy service on a busy machine will answer, and short enough that a wedged one gets classified quickly and everything else still gets checked. A slow answer and no answer are, for this purpose, the same answer.
There's a per-probe override for the handful of things that legitimately take longer, but the default is aggressive on purpose. I would rather occasionally mark something down that was merely slow than build a dashboard nobody waits for.
Knowing which network you're on
A wrinkle specific to labs with more than one segment, and one I got wrong twice.
The machines here have more than one address. The main server is on the wired lab network and also on the house Wi-Fi. Which address you should use to reach it depends entirely on where you're asking from - the workstation on the wired segment, or a laptop in another room.
So the service takes a segment setting and resolves host addresses accordingly. One environment variable, and the same code produces a correct picture from either vantage point.
I'll flag the trap, because it cost me an hour and it's in the code as a comment now: the addresses moved. The main server used to sit on the lab's Wi-Fi segment and doesn't any more, and the address it vacated was later picked up by something else entirely. Any monitoring that hardcodes an address is one DHCP lease away from confidently reporting on the wrong machine - and confidently is the operative word. It won't error. It'll show you green, for a host that isn't the one you think.
Is it working, or is it thinking?
This is the feature I didn't anticipate wanting and now consider essential.
"Up" and "busy" are different states, and for a lab full of AI services the difference is most of what you want to know. A model server with a large model loaded and generating is working very hard. A model server sitting idle is also fine. But they're not the same, and if the assistant seems slow, "is something running right now" is the actual question - not "is the process alive."
So the heartbeat document carries a notion of active thinking. For the model server it comes from asking which models are currently loaded and running. For other AI services, an optional endpoint they expose if they have something meaningful to say about being mid-work.
This turned out to be the input for a much more fun project - putting that state on a wall of light panels, so I can see the lab thinking from across the room without looking at a screen at all. That's the next post.
One origin, many services
A practical note that saved a lot of grief.
The dashboard is a single-page app served from one host. The services it wants to show live on several. Browsers, quite rightly, don't love a page from one origin making requests to a handful of others - you get into CORS configuration on every service, or mixed-content problems, or both, and you end up maintaining a list of allowed origins in a dozen places.
So the heartbeat service proxies. The dashboard talks only to it, and it forwards to whatever's behind - the health service, the vision service, and most recently the model trainer over on the GPU box. From the browser's point of view there's one origin and no cross-origin anything.
I re-learned this the hard way as recently as last week, building a new tool page that talked directly to another machine and getting blocked immediately. Pointing at a second host was the mistake; the network isolation was doing exactly what it should. Adding one more proxy route took five minutes.
Every reading has an age
The idea underneath all of this - and the one I'd most like you to take away - is that a measurement without a timestamp is a rumour.
A status page that says "healthy" is making an implicit claim about when. If that reading is four seconds old, it's a fact. If it's forty minutes old because the probe loop died and the page is serving whatever it last knew, it's a lie in the shape of a fact, and it looks identical.
So readings carry their age, and the age is displayed, and the interface renders staleness as a visible property rather than a footnote. Later in this series this becomes much stricter - there's a part of the lab where an unaged reading is structurally unrepresentable, where you cannot construct one in code - and that came directly from getting burned here first.
If you're starting
You don't need twenty services to want this. You need about four, which is roughly the point where you stop being able to hold the list in your head.
And it doesn't need to be sophisticated. A script that hits five URLs with a short timeout, prints a table, and stamps the time is most of the value. I ran something very close to that for months before it grew into a service with a UI. The sophistication came later and it came from use - every feature described above exists because I wanted it while staring at the simple version, not because I planned it.
Start with the table. Put the time on it.
Next: the array underneath all of this, which has no redundancy at all, and the audit that found what wasn't being backed up.
The lab so far
This post is part of an ongoing series — the home-lab build written down as it happens, in order:
- Load-Bearing Docs: How a Homelab Learns to Stop Lying to Itself — Jun 30, 2026
- 1.7 Tokens Per Second: How the Lab Got Its GPUs — Jul 2, 2026
- Is Any of This Even Running? Building the Lab's Single Pane of Glass (you are here) — Jul 4, 2026
- Zero Redundancy: Backing Up a Striped Array I Chose On Purpose — Jul 6, 2026
- Two Platforms On Purpose: systemd, k3s, and Refusing to Migrate — Jul 8, 2026
- Body Language: Giving the Lab a Face on the Wall — Jul 10, 2026
- An Operator Console, Not a Dashboard — Jul 12, 2026
- From Wake Word to Soundbar: The Whole Voice Pipeline — Jul 14, 2026
- A Dropped Log Is Worse Than an Ugly One — Jul 16, 2026
- Where Does This Sentence Go? The Gateway Problem — Jul 18, 2026
- Mostly Arithmetic: Classifying Intent Without Training Anything — Jul 20, 2026
- Teaching the Lab to Know Me: Journals Into Structured Data — Jul 22, 2026
- The Index That Was Quietly Empty — Jul 24, 2026
- Two Stages and a Refusal: Routing Inside the Memory — Jul 26, 2026
- Looking Outward: A Small Data Lake for Public Sources — Jul 28, 2026
- The Coach That Doesn't Use a Model — Jul 30, 2026
- How Helen Came to Be: Four Voices and a State Machine — Aug 1, 2026
- A Refusal a Model Can't Be Talked Out Of — Aug 3, 2026
- Seven in the Morning: What Helen Says, and Why No Model Writes It — Aug 5, 2026
- Helen Gets a Command Surface — Aug 11, 2026
- Putting the Lab in a Chat Window: Agent Skills, Flows, and CI/CD for AnythingLLM — Aug 19, 2026
Before it was a series: earthquake data and local LLM reasoning, the Slack integration that followed, CLI vs Open WebUI on context, the AnythingLLM ADR, and the LLM-owned wiki pattern.
Credits
Hero photo by Luke Chesser on Unsplash.