Earthquake Data, .NET, and Local LLM Reasoning
I have been using the USGS earthquake web services on and off for a long time now because they are one of those public data sources which are both genuinely useful and universally useful. Maybe it's the earth science nerd in me, or that earthquake data that keeps pulling me back in because it's global, constantly changing, easy to model, and full of opportunities to ask better questions and challenge theories.
This mini project was also inspired by Mostly Lucid’s excellent post, Analysing Large CSV Files with Local LLMs, shout out to JD for sharing that, which helped reinforce a pattern I have been thinking about for a while now: the best use of an LLM often comes after the data has already been collected, cleaned, and summarized by code. I also used this earthquake example as a small educational demo with some developers because it creates a very practical boundary between software engineering and AI via API integration patterns we use for our day jobs. The code does the measuring. The model helps with the explaining.
Note: I have the repo set to private for now, but if there is interest, I can make it public. Just drop me a note.
Small project, real data, useful pattern.
Why this one interested me
Some projects are fun because of the framework, some because of the architecture, and some because the subject matter itself has enough gravity to hold your attention. This one had a little of all three.
I wanted something small and teachable. Something that used real public data. Something that fit naturally into my lab. And something that showed a cleaner way to think about AI than the usual “throw raw data at a model and hope for usable content" pattern.
Earthquake data works well for that.
It gives you just enough structure to do meaningful analysis:
- event counts
- magnitudes
- locations
- significant vs major events
- patterns over short time windows
That, in turn, gives an LLM something worth responding to. Not a pile of raw records, but a prepared summary with functional data points in it.
The shape of the mini project
At a high level, the project is a .NET console application that downloads CSV feeds from USGS, parses the data into strongly typed records, computes some baseline statistics, and then hands the summary off to a local model for reasoning and narrative analysis.
That flow matters to me because it keeps the responsibilities clear:
- USGS provides the source data
- .NET handles retrieval, parsing, and deterministic computation
- The local LLM provides interpretation over the provided (data) as facts
That feels like the right division of labor to me vs just "chatting with your data."
Mini project flow
Below is the basic flow for the earthquake LLM analysis project.
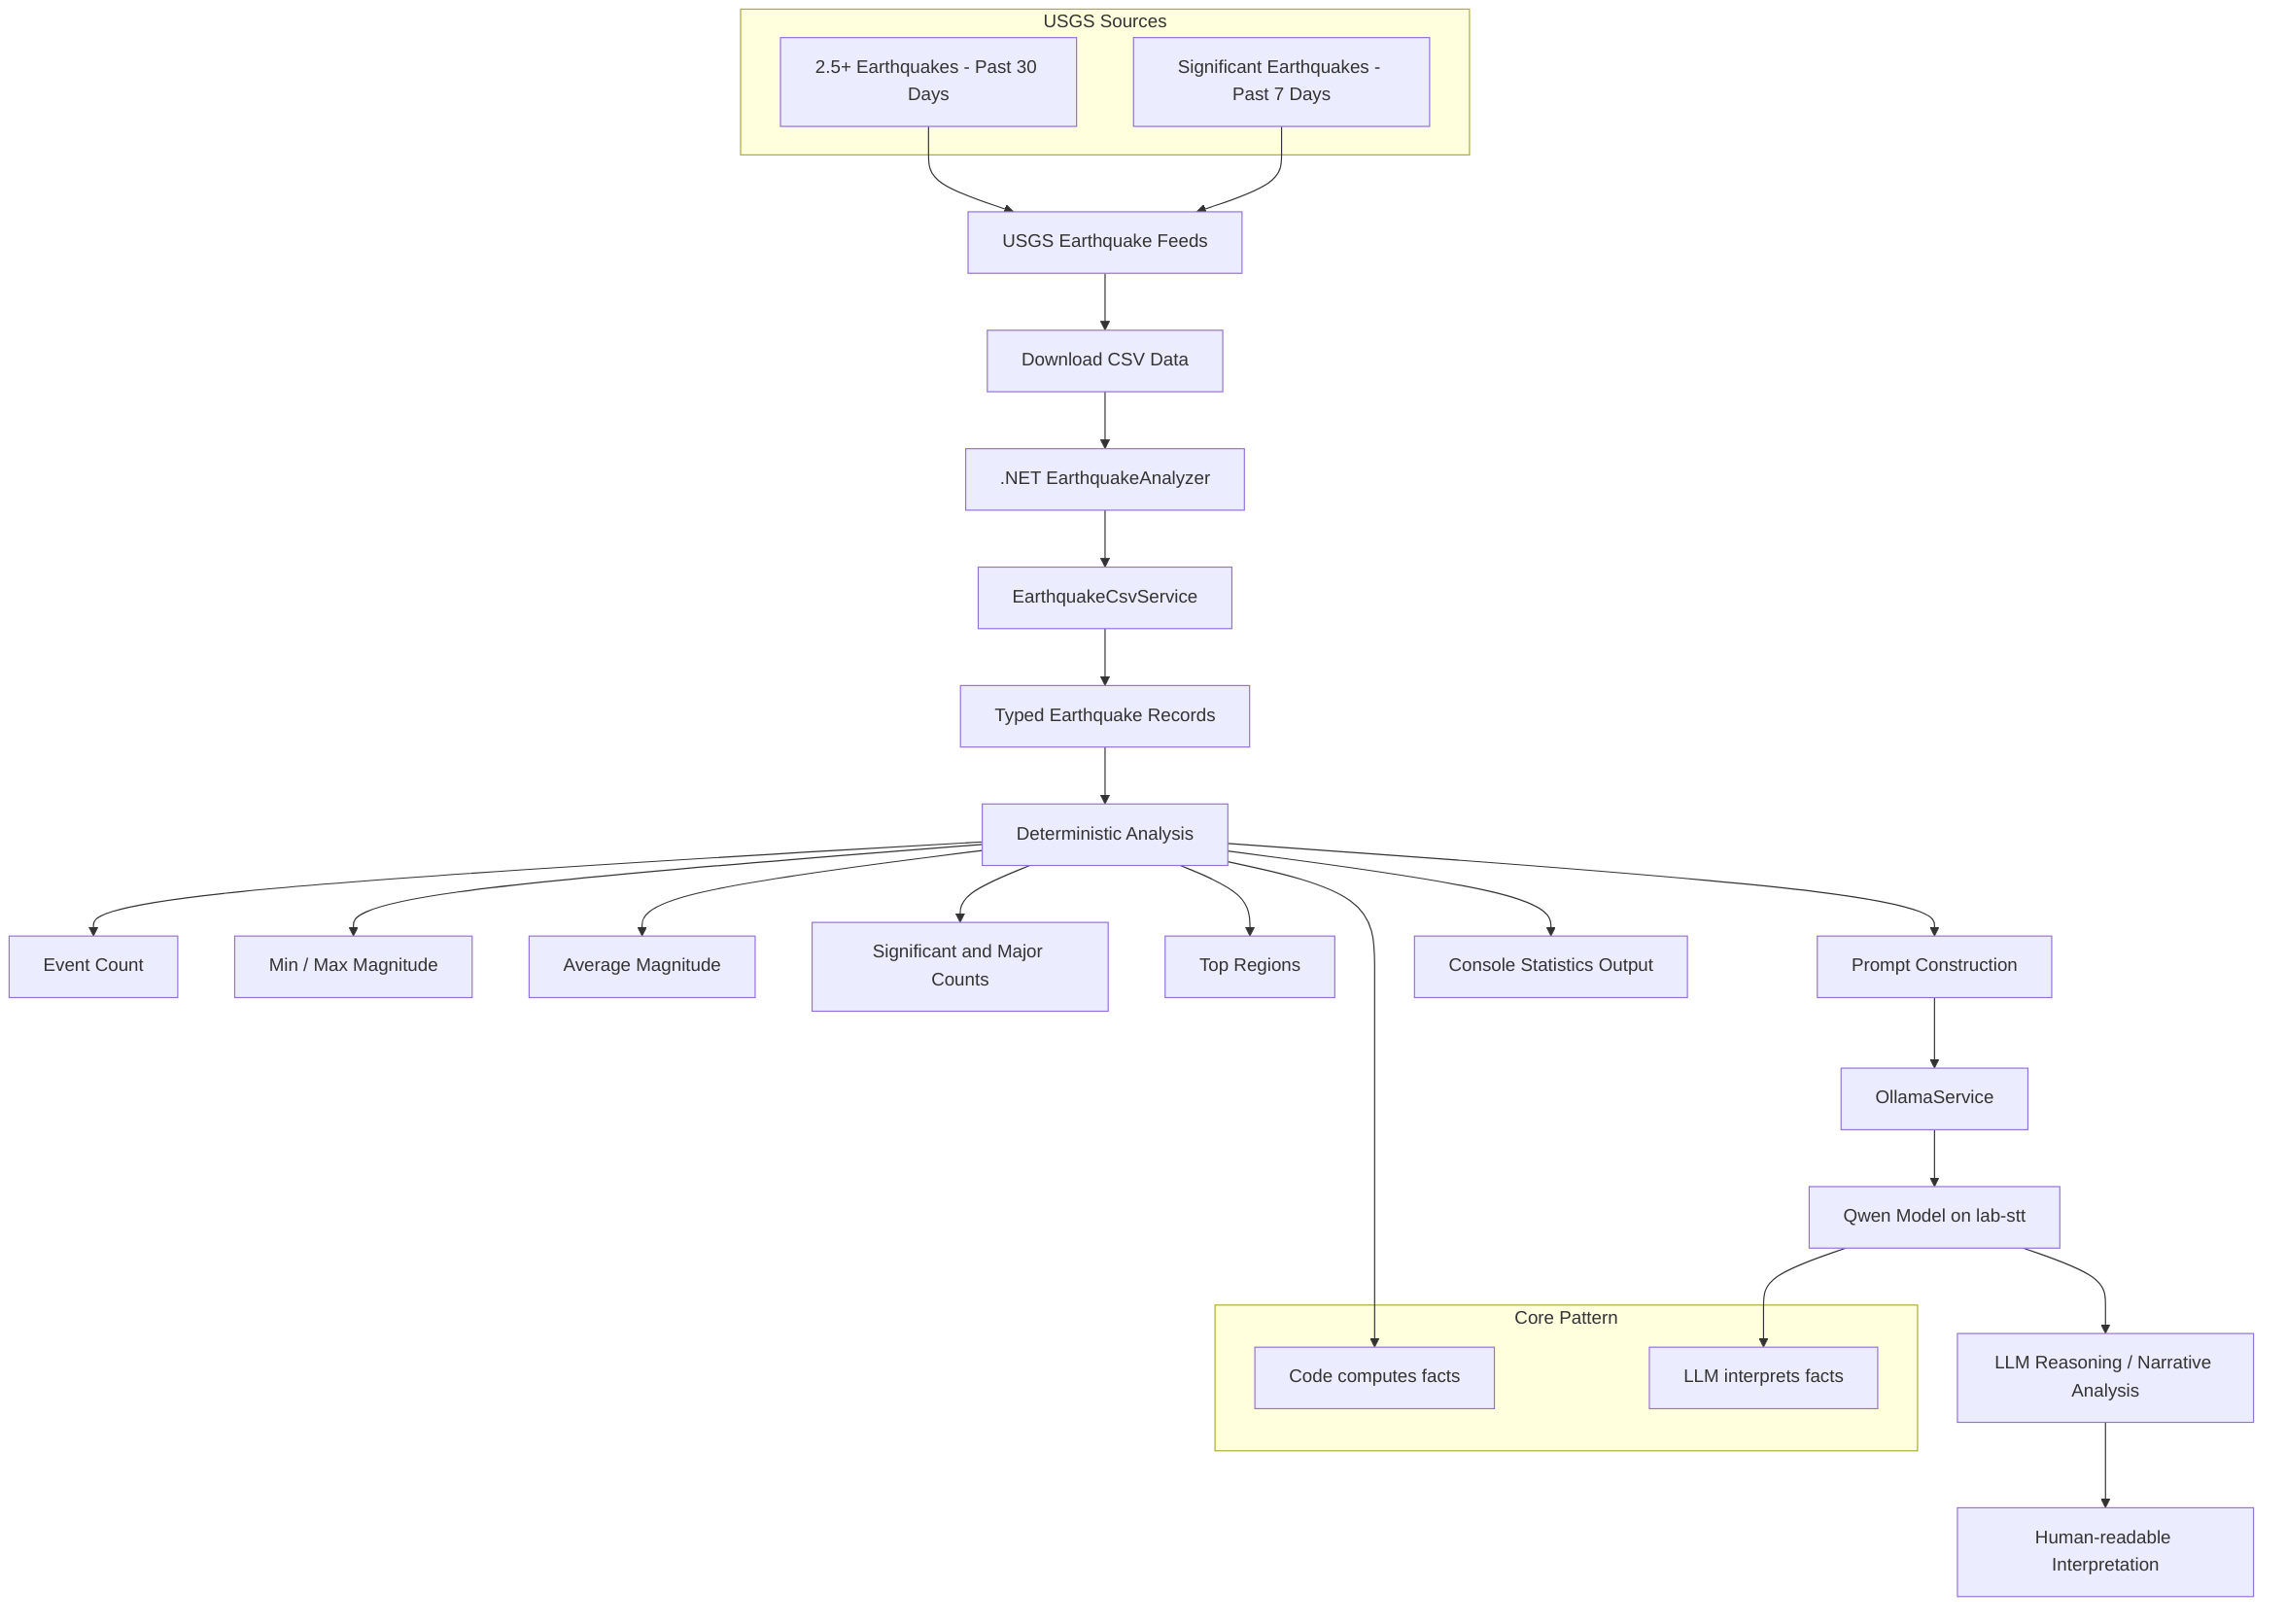
Figure 1. The earthquake mini project keeps the boundary clear: code computes the facts, and the model works from those facts to generate interpretation.
Why I like this pattern
The thing I wanted to show with this little demo is that LLMs are a lot more useful when they are not being asked to do "the thinking."
If you let code handle the mechanics first, a lot of the drift, well, just narrows a bit.
The application already knows:
- how many events were in the feed
- the smallest and largest magnitudes
- the average magnitude
- how many crossed thresholds that actually matter
- which places appeared most often
Once those facts are known, the model can be used for a narrower and more realistic job:
- summarize the activity in plain language
- point out notable concentrations or anomalies
- describe the overall seismic picture in a way a human can scan quickly
- provide a narrative layer on top of deterministic results
That is a more trustworthy setup than using the model as the data pipeline.
A quick word on the inspiration
I want to give credit, again, to Mostly Lucid’s post, Analysing Large CSV Files with Local LLMs, because it helped sharpen the thinking behind this experiment. The core idea that struck me was not just “use an LLM on CSV data,” but rather that local models become much more practical when paired with a workflow that does some real preparation before the prompt is ever built.
The .NET side of the build
The .NET project itself is intentionally small.
There is a reusable client library for the CSV parsing and model communication, and then there is the console application that drives the interaction. That makes it easy to keep the educational value high without burying the whole point under too much scaffolding.
The practical steps are straightforward:
- Download a CSV feed from USGS
- Parse the records into typed models
- Compute summary statistics
- Build a prompt from those stats
- Send the prompt to the local model
- Return a human-readable interpretation
That sequence is useful beyond this specific domain. You could reuse the same pattern for logs, metrics, support tickets, document inventories, or operational data of almost any kind. So, basically, this is my first non Intent Analysis or OCR based use case for so many other projects in conjunction with LLM products with code.
The lab behind the demo
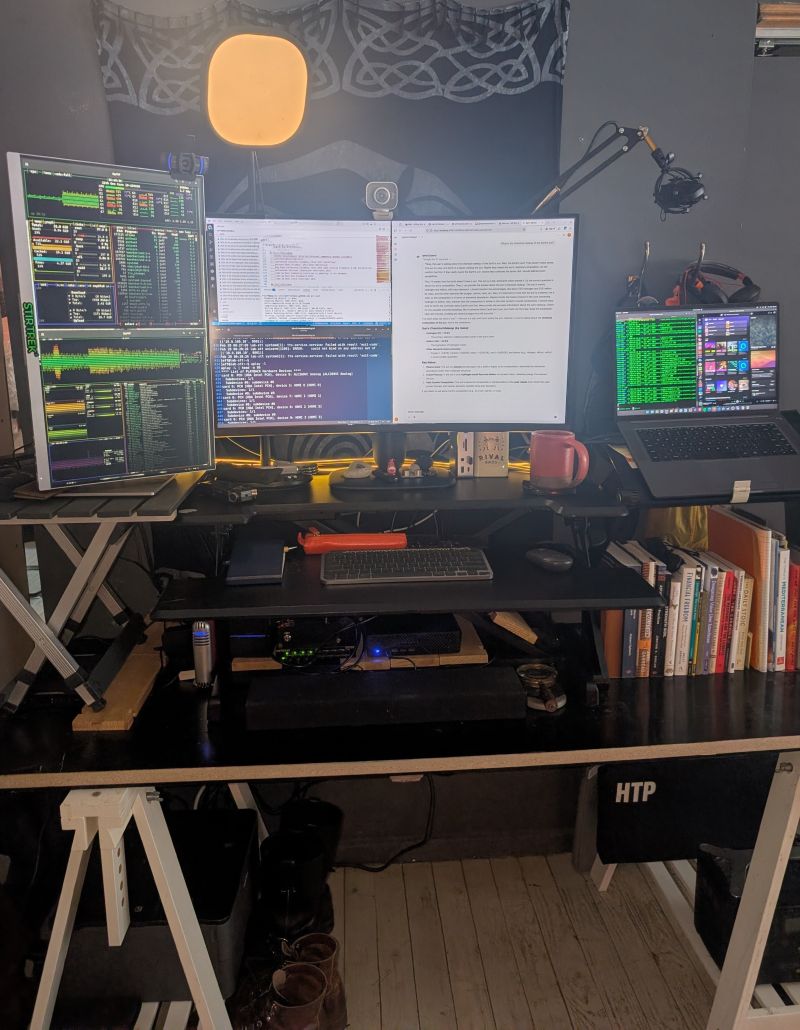
Part of the fun of this project is that it lives in my own home lab environment that is slowly turning into a genuinely useful local AI playground. It's taken me literally months now to get this setup as resiliant as it is now. Fully capabale now with both the Vision and LLM GPU devices running.
The workstation acts as the main development and operator node. The lab-stt, Minisforum MS01, server handles the core AI services, including Ollama, Qwen3, Whisper-based speech-to-text, Docker and general systems automations. There is also a Pi edge device for mic/camera UI and local edge storage, the Nvidia Jetson Orin node for vision and inference experiments, now, with the GPU expansion node, a DEG1, that takes the model hosting off of CPU to a decent GPU for overall acceleration of the LLM work.
Here is my current local first lab architecture (with tertiary cloud backup, and DR, not reflected here).
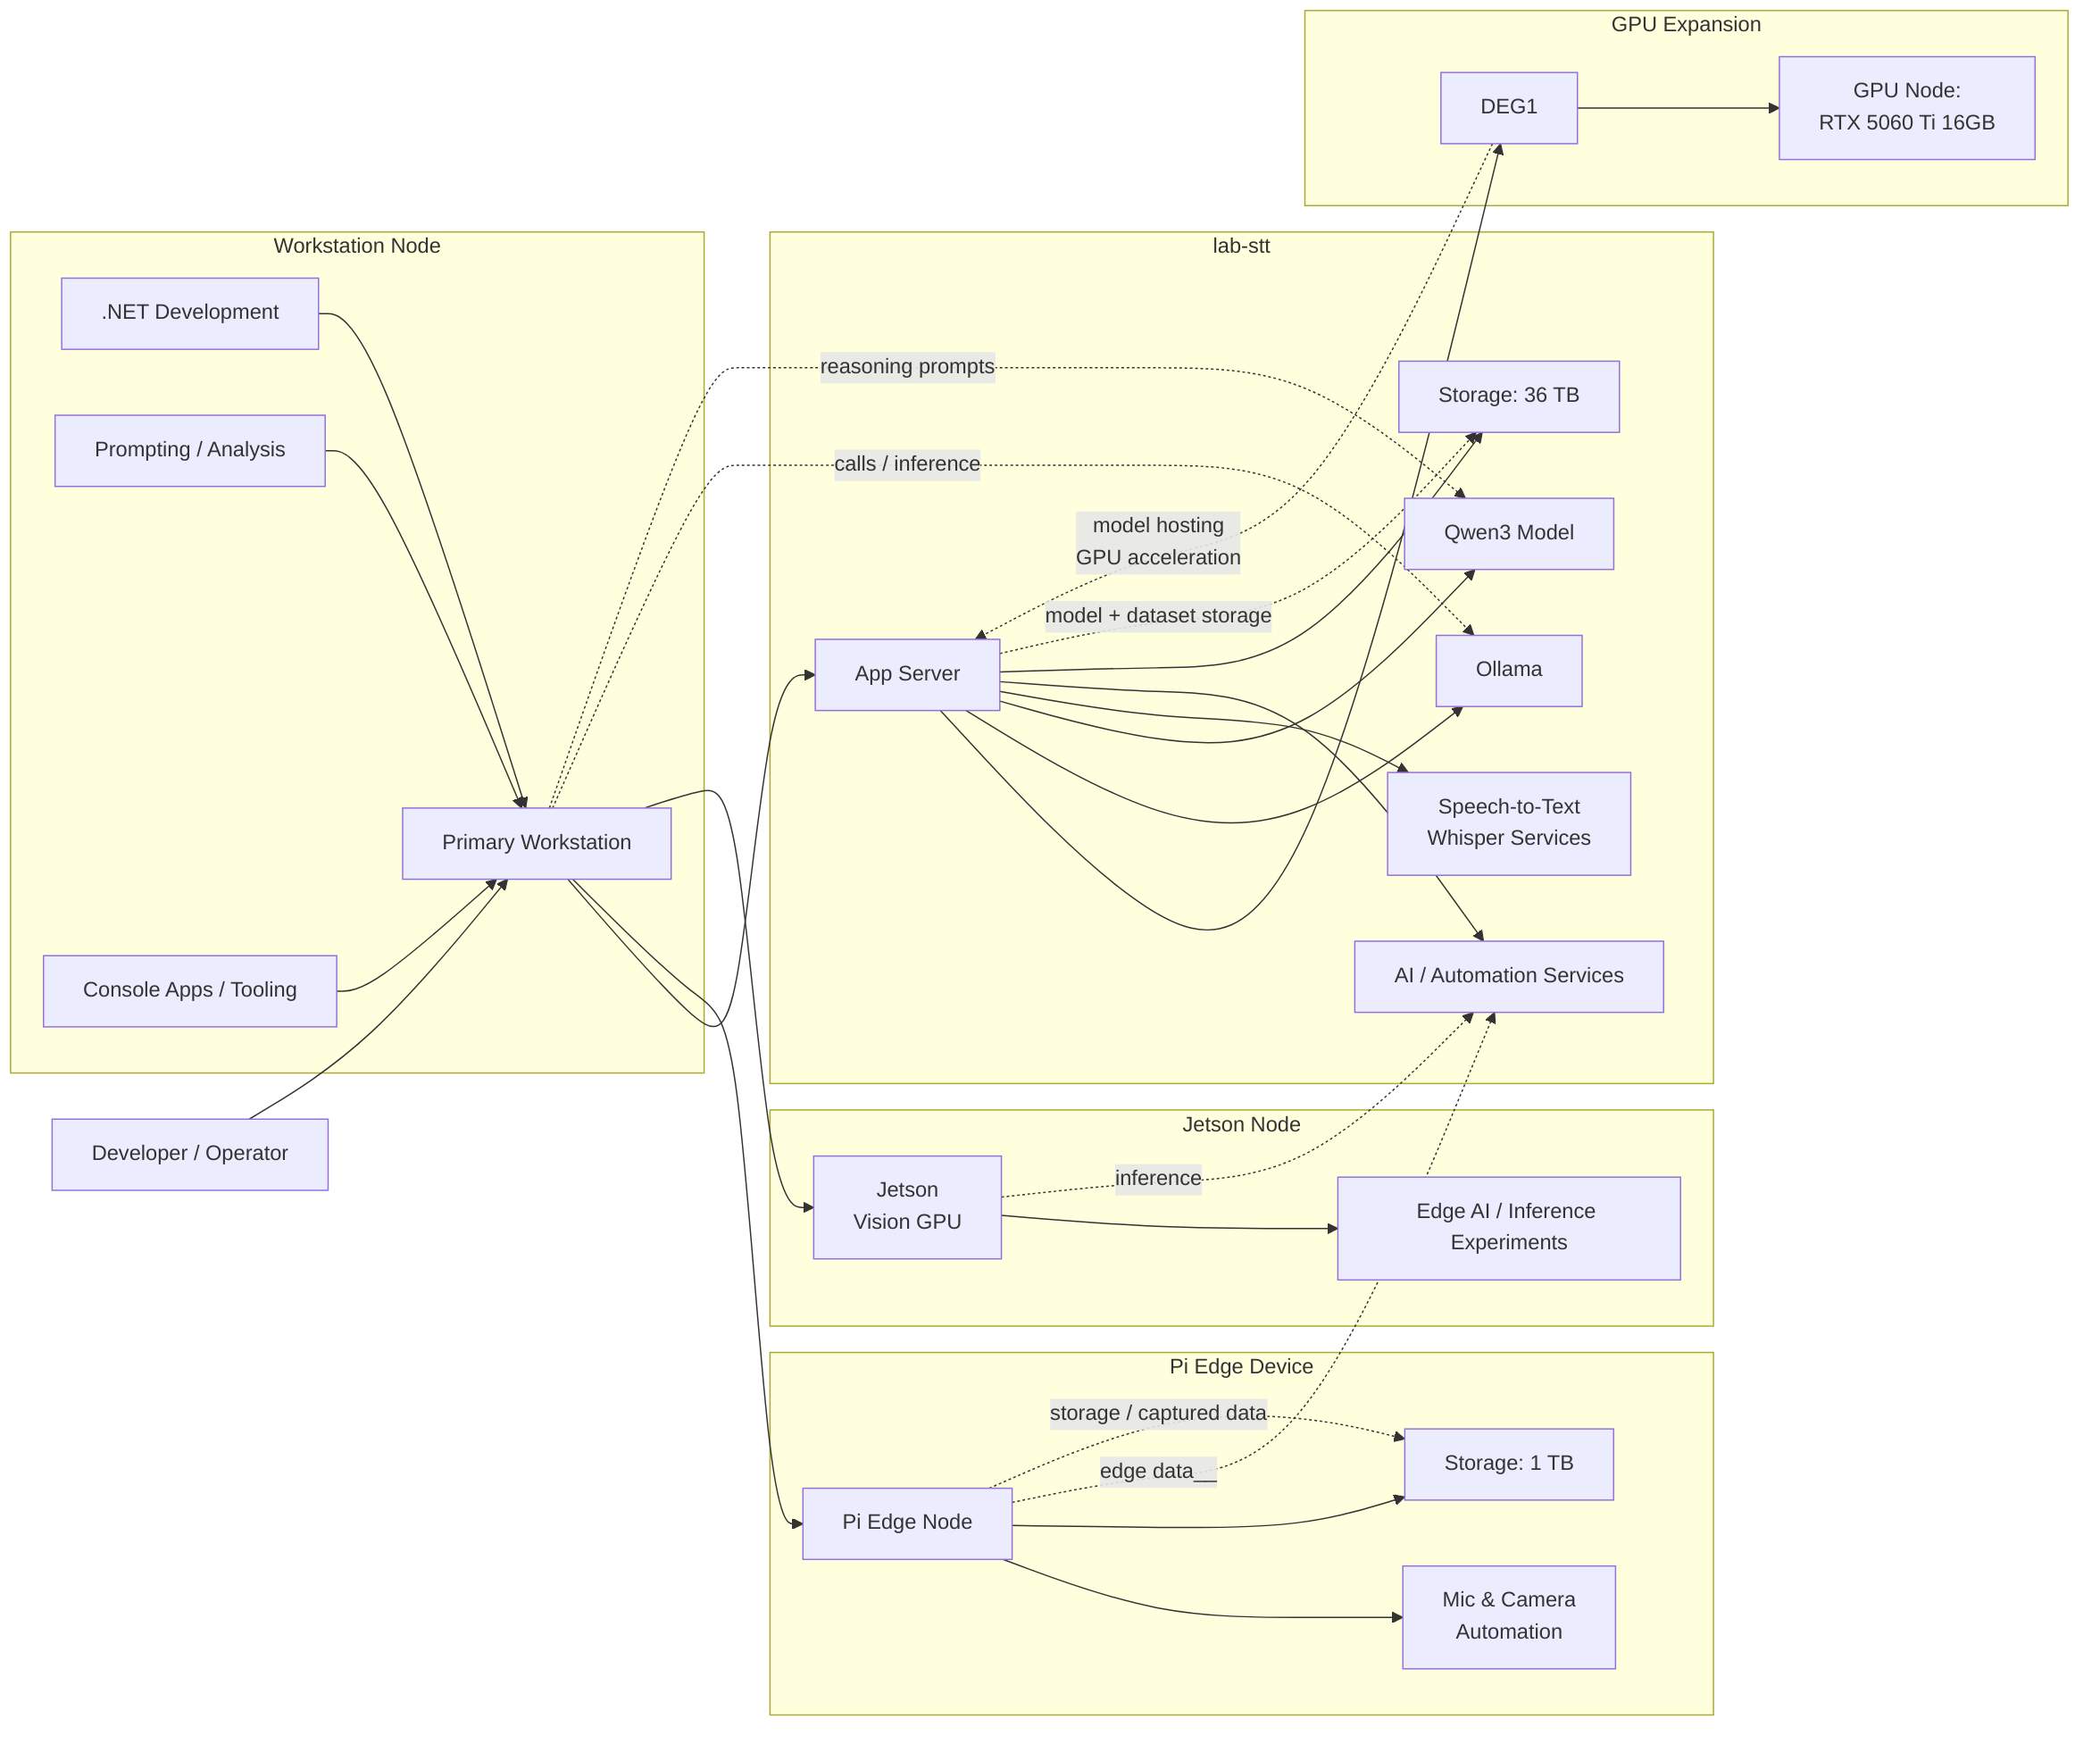
Figure 2. The lab is not really about collecting hardware for its own sake. It is about having a practical environment to experiment, learn, and build local workflows that are actually useful and fully private.
Why local matters here
Not because local is morally superior or magically better, but because it makes the whole loop feel more understandable and more yours. You can see the application, the services, the data flow, and the model endpoint all working together in a controlled environment.
That counts in a small project like this, and I think it should factor into more in our larger ones where "cloud" can become a set of products with a lack of "hands on" with the tools. Don't get me wrong, cloud is my bread and butter, but it's still, someone elses' machines.
When the workflow is local and observable, the design decisions become clearer:
- what should be computed directly in code?
- what should be stored?
- what should be summarized?
- what should be sent to a model?
- what should stay human-reviewed?
That is where a lot of AI work starts becoming less theatrical and more practical for me. It is not about "the model" as a magic box, but about how the model fits into a larger system of data and software.
What this was really trying to teach
I originally used this as an educational demo, and the lesson was not “look, AI!”
The lesson was closer to this:
- start with a real source of truth
- model the data cleanly
- let software do the counting
- let the model work from prepared facts
- keep the result understandable to people
That may not be the flashiest version of AI, I mean, it's sort of boring actually, but I think it is one of the more intellectually tangible ones.
Honestly, that is the part I enjoy most anyway: building something small that helps people see the shape of a good pattern.
Closing thoughts
I have always liked projects where the technical design and the teaching value line up cleanly. This one did that for me.
The USGS feeds made for a dependable and science-based data source. The .NET side kept the pipeline grounded using a language I understand and can code. The local model added a reasoning layer without pretending to replace the application with "AI" for the sake of "AI." The lab itself gave me a place to make the whole thing real.
If there is a larger point here, it is probably this: useful AI systems usually begin with reliable, well-prepared information. The model is rarely the whole story. More often, it is the final layer in a chain of choices about data, structure, and intent.
That feels true in earthquake analysis, and it feels true in a lot of other work too.